Watch Products Dashboard
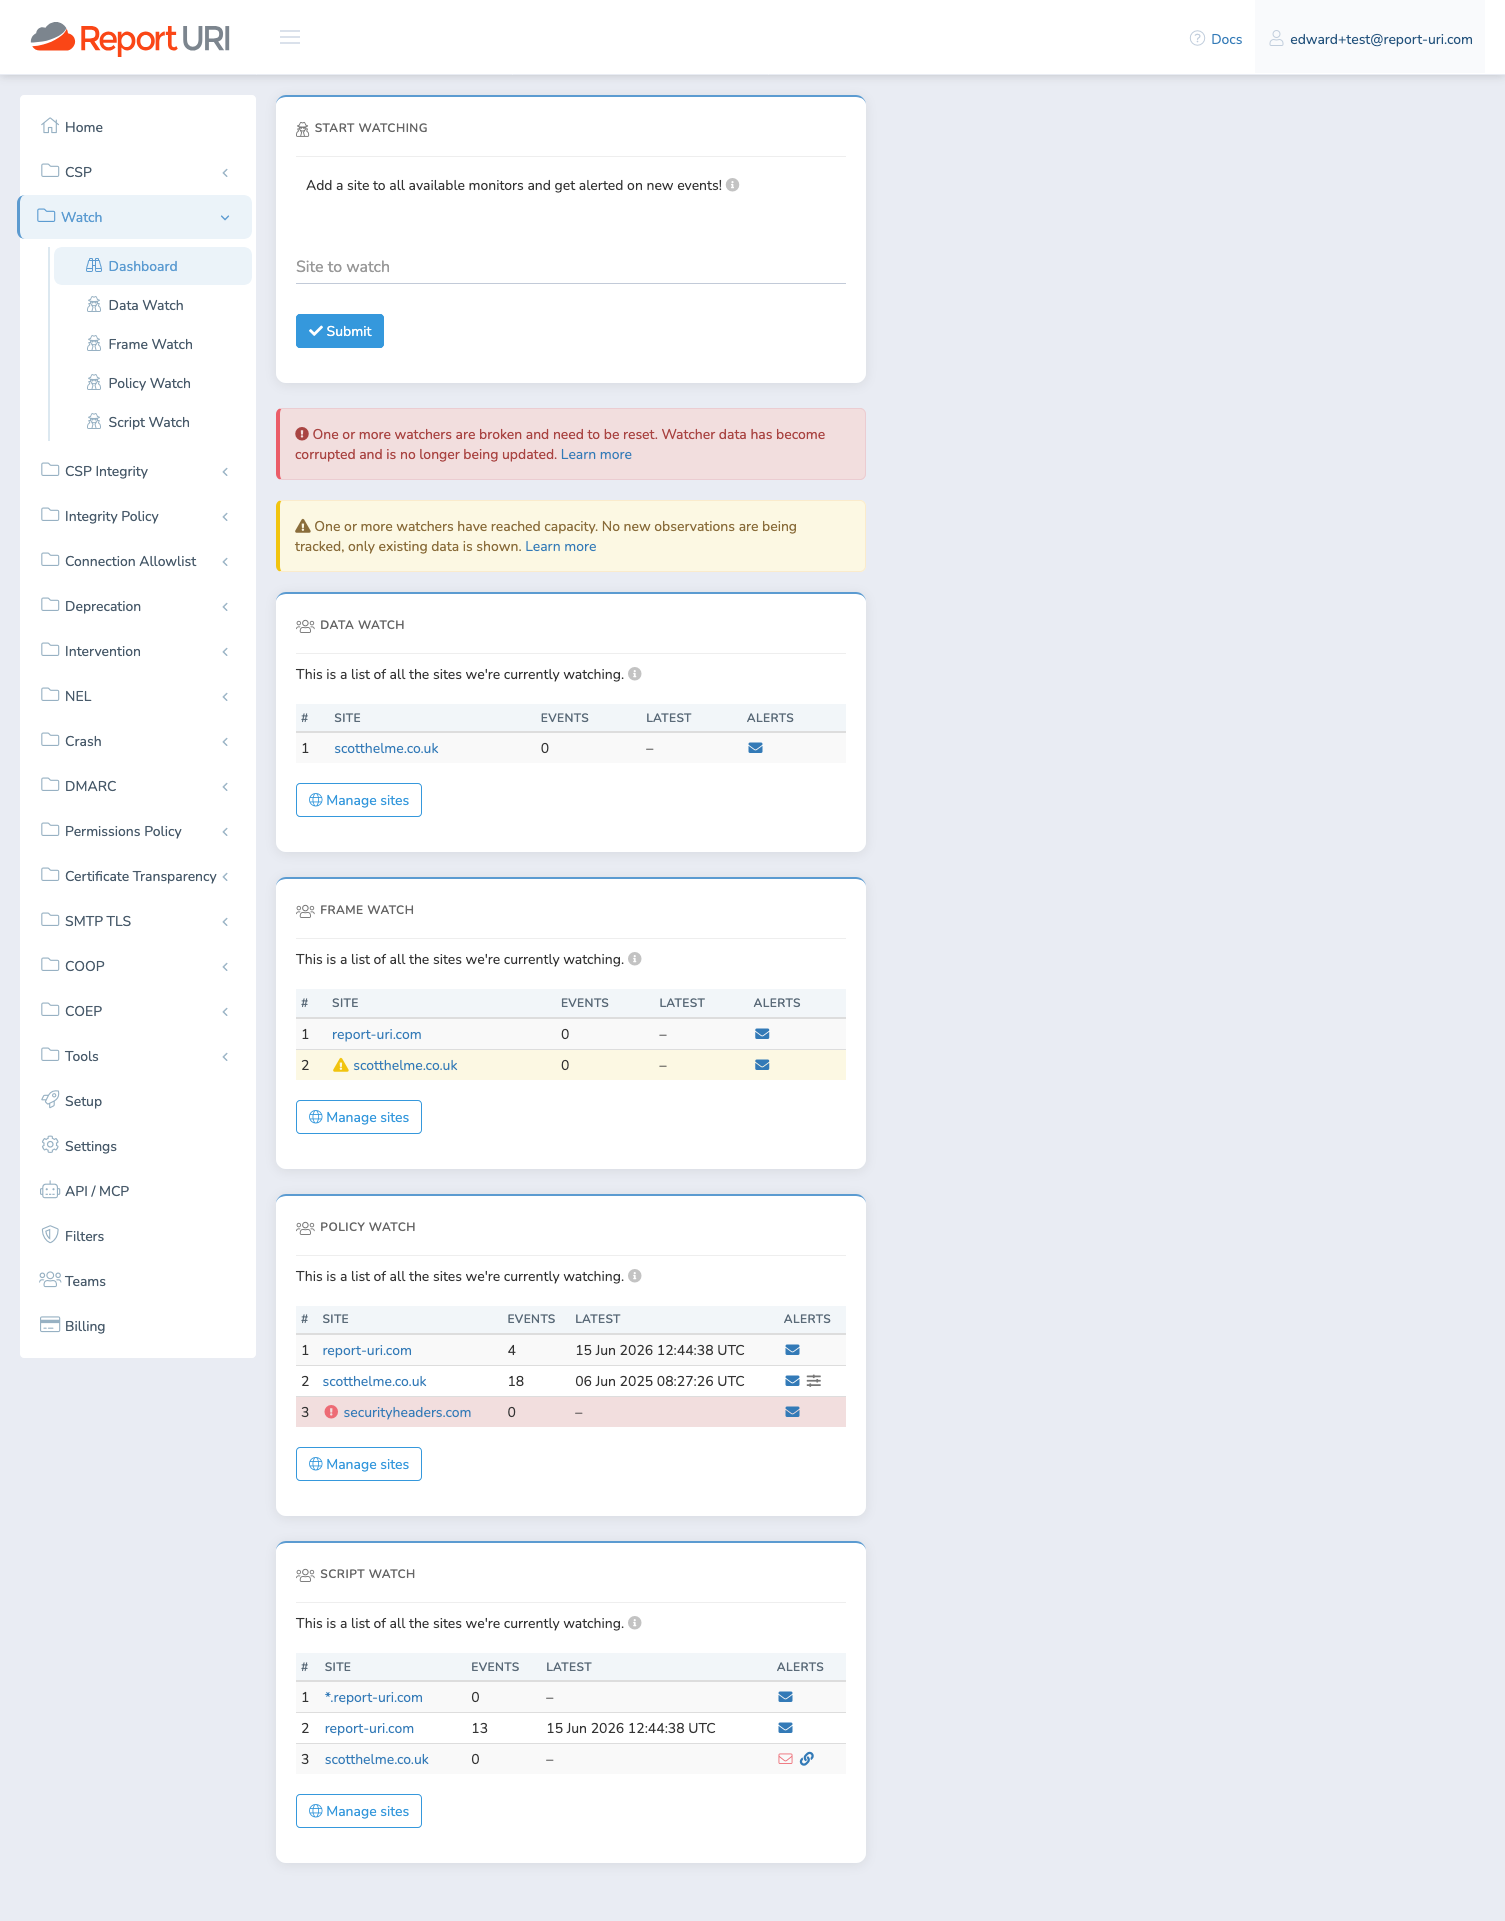
The Watch products dashboard is the overview page for all of your watchers. It lists every site you are monitoring across Script Watch, Data Watch, Frame Watch, and Policy Watch in one place, with at-a-glance status and alerting signals for each watcher.
Add a site to all available monitors
The form at the top of the page adds a single site to every available Watch product at once, rather than adding it to each product separately. Enter the full hostname of the site to monitor — www.report-uri.com and blog.report-uri.com are treated as two different sites and monitored separately.
Reading a watcher row
Each Watch product has its own table listing the sites it is watching. For each watcher you see the number of events recorded, when the latest event arrived, and a set of alerting indicators. A Manage sites button below each table opens that product's page, where you can inspect, reset, delete, or configure individual watchers.
While a watcher's event count is still being calculated, its Events and Latest columns show – and a notice appears at the top of the page. The count appears within 30 minutes.
Status
A watcher's status is shown by the colour of its row and an icon next to the site name. The dashboard also shows a banner at the top of the page if any watcher is at capacity or broken.
| Appearance | Status |
|---|---|
| No highlight | Active — recording new observations normally |
| Amber row, warning icon | At capacity — frozen; existing data is shown but no new observations are recorded |
| Red row, error icon | Broken — data has become corrupted and cannot be read until the watcher is reset |
See Watcher Capacity for what the At capacity and Broken states mean and how to resolve them.
Alerts
The Alerts column summarises how each watcher will notify you, using the same defaults as the Config modal.
| Icon | Meaning |
|---|---|
| Solid blue envelope | Email alerts are on (the default) |
| Hollow red envelope | Email alerts are off |
| Blue link icon | Webhook alerts are enabled (no icon means webhooks are off, the default) |
| Sliders icon | This watcher has non-default configuration — a raised alert threshold, exclusions, or no-telemetry alerting. Hover over the icon to see which |
A hollow red envelope means email alerts have been turned off for that watcher, not that anything is wrong — for example, a watcher set up to alert by webhook only.